High-Throughput Thermodynamically Controlled Refinement
The Optimize Potentials module performs automated high‑throughput screening of up to one million crystal structures to derive statistically robust and chemically diverse interaction potentials. It filters structures based on relevant pair interactions and refines the resulting potentials using a thermodynamically constrained dual‑class SVM that enforces correct Gibbs free‑energy behavior for real and distorted structures.
Dual-Class SVM Energy Physics
The optimization is fundamentally anchored by the Gibbs Free Energy (G). Our SVM approach enforces two physically mandatory conditions:
- Class 1 (Experimental): Structures must possess a negative total energy, representing their inherent thermodynamic stability.
- Class 2 (Distorted): The differential energy (Gdistorted - Gexperimental) must remain positive, ensuring the experimental lattice resides in the global minimum.
Graphical User Interface
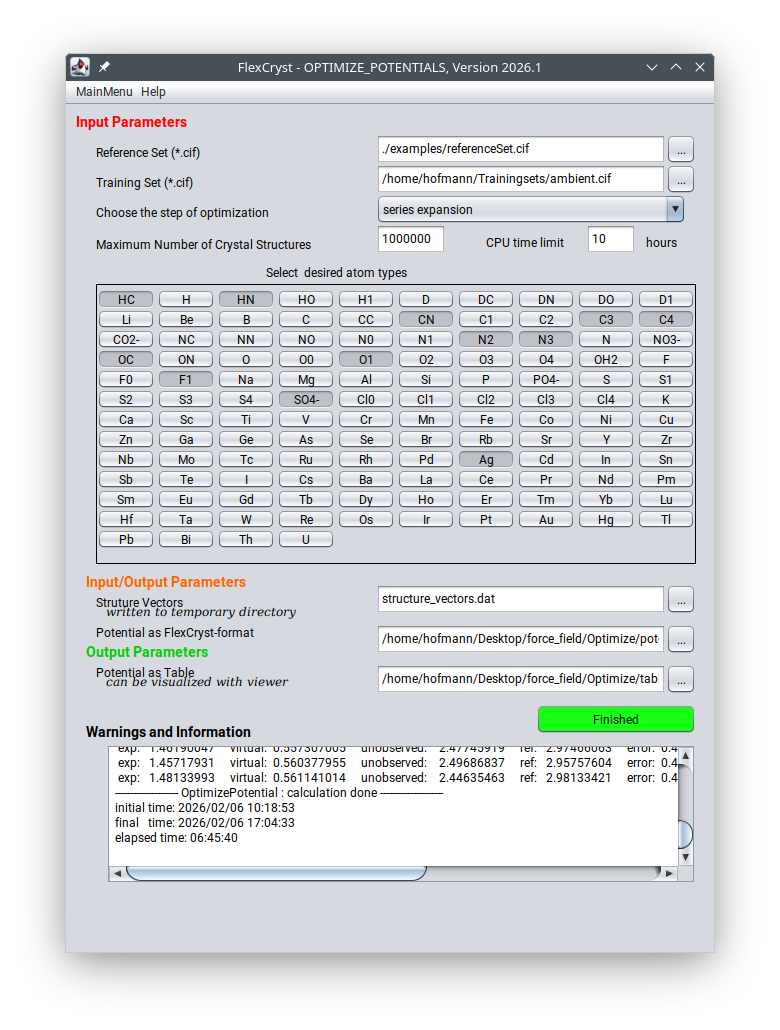
Figure 1: FlexCryst GUI for automated screening and atom-type selection across million-structure databases.
Automated 4-Step Validation Protocol
FlexCryst then applies a four‑level validation and refinement protocol to convert raw structural statistics into consistent empirical potentials:
Level 1: - RDF Extraction
– Computes radial distribution functions g(r) from the large structural dataset.
Level 2: Boltzmann Approximation
– Generates initial potentials via w(r) = -kBT ln[g(r)]
Level 3: Analytical Taylor Expansion
– Fits the Boltzmann potentials to a 12‑term inverse‑power Taylor series.:
G(r) = Σi=112 (ai / ri)
Level 4: SVM-Driven Parameter Refinement & Consistency Check
– Uses SVM optimization to refine coefficients and ensure the final potentials reproduce the original RDFs and match thermodynamic constraints such as sublimation enthalpies and phase stability at 298.15 K.
Correlation Coefficient (R²): 0.9989
Mean Error (ME): -0.05 kJ/mol
Energy Correlation
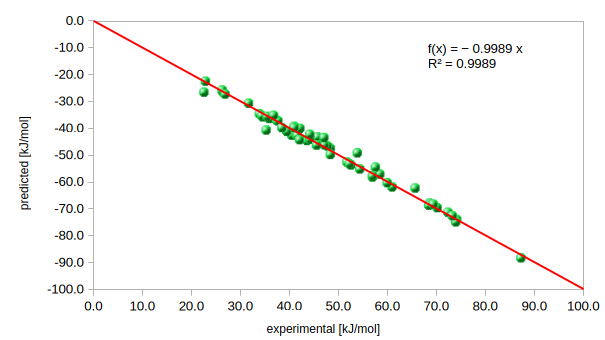
Figure 2: Regression analysis for the 57 reference structures. The R² value of 0.9989 confirms the predictive power of potentials derived from million-structure screening.